What's New in SmartCBM®: October 2022
Release Highlights
Enterprise Level Views
The SmartCBM® software dashboards now allow you to look across your sites to view the equipment health of your entire enterprise. This adds to the existing filtering options so you can now view your data at enterprise, site, or department levels.

Site and Department-Level Details Views
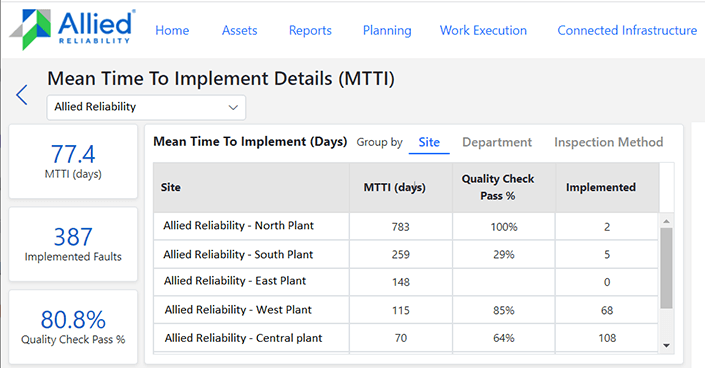
New grouping options on the SmartCBM dashboards allow quick comparison of your program KPIs either by site, department, or inspection method. This makes it easier to identify areas that are doing great and those that may need some extra attention.

Sensor Orientation Change Detection
SmartCBM can now identify installation problems with sensors in the field. This includes the detection of dislodged sensors or sensors that are no longer properly aligned with the equipment. When SmartCBM detects issues, it will send out a notification email for the problem as well as highlight the issue on the connected infrastructure dashboard. We are continually expanding our ability to remotely monitor the health of your sensors to make sure that equipment is always monitored.
Connected Infrastructure Dashboard
The available data on the connected infrastructure dashboard has been extended for sensors and gateways to make it easier to inspect and maintain this equipment. The following fields are now available in the tables and exports:
- Sensors
- DeviceType - Sensor manufacturer
- StartBatteryAlarmDt - Initial date at which the sensor's battery indicated that it was low enough to need replacement.
- StatusText - Detailed information for sensor problems is now available in the export file to put actionable information in the hands of your technicians.
- Gateways
- Manufacturer - Gateway manufacturer
- Model - Gateway model number
- DeviceType - Gateway device type
- IpAddress - IP Address of the gateway
- FirmwareVersion - Version of the gateway firmware
- AppVersion - Version of the gateway app software
Home Page Performance Improvements
The speed at which the SmartCBM dashboards are displayed has been greatly improved. This eliminates the waiting period to load the homepage on initial entry into SmartCBM.
Search
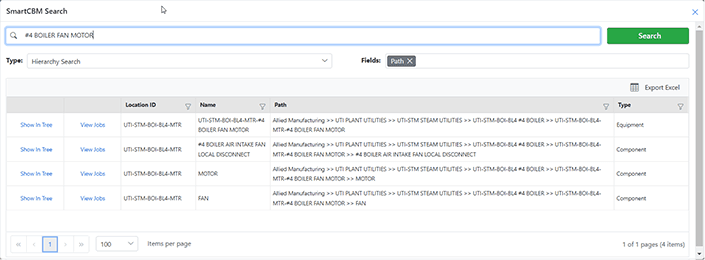
A new search option has been added to make it easy to quickly navigate to an area of interest within SmartCBM.
For example, this can be used to quickly navigate to a piece of equipment through the equipment name or the sensor ID on the equipment. To reach the Search feature, click on the magnifying glass icon at the right-hand side of the SmartCBM header.

