
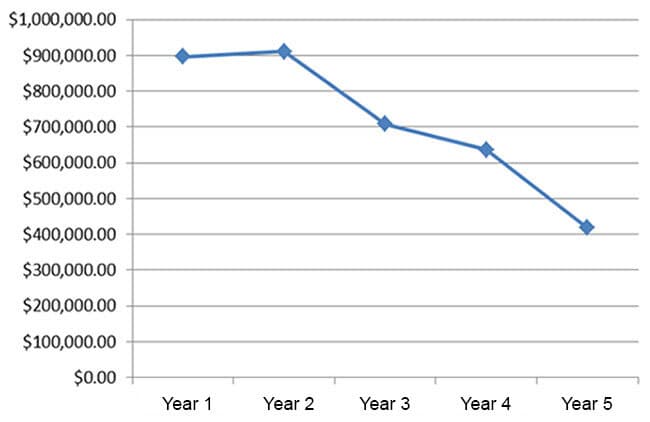
Cost Trend in USD (Year 1 through Year 5)
HOW A PREDICTIVE MAINTENANCE PROGRAM OUTPERFORMED TRADITIONAL PLANNED OR DEMAND MAINTENANCE
Allied Reliability worked with a community hospital to establish a reliability-centered maintenance (RCM) program for improved medical equipment reliability. This case study presents data collected over a five-year period to assess the program’s value. It serves as an example of what can be accomplished when an official RCM program is put into action, reducing both time and money spent on overall maintenance.

Hospitals operate increasingly complex, critical technical equipment that must be maintained on a regular (ideally, proactive) basis for the utmost accuracy and reliability to save lives and treat a wide range of patient needs—from chronic illness to emergency room crisis, to routine wellness checkup, and more. Maintenance costs and the technicians needed to perform diagnostic/repair/replacement tasks represent a big budget item necessary to keep things running smoothly as downtime is just not an option when human lives are on the line. To right size the maintenance effort and ensure that the most critical tasks were completed proactively, a community hospital partnered with Allied Reliability to implement an RCM program.
The goal of an RCM program is to seek an optimal mix of condition-based actions, other time- or cycle-based actions, or run-to-failure to reduce overall costs (maintenance and operations) to maximize organizational readiness (facility, mission). One step of the development of the equipment maintenance strategies was to analyze the preventive maintenance (PM) program. We identified and eliminated tasks that were attempting to detect failure modes, which could be managed more efficiently via condition monitoring technologies. The charts below demonstrate the initial savings in dollars and man-hours as the program matured, and tasks were eliminated in year three and four.
Calendar Year |
Cost of PM |
Percentage Change |
Total Hours |
Year 1 – Project 1 Executed |
$897,064.22 |
N/A |
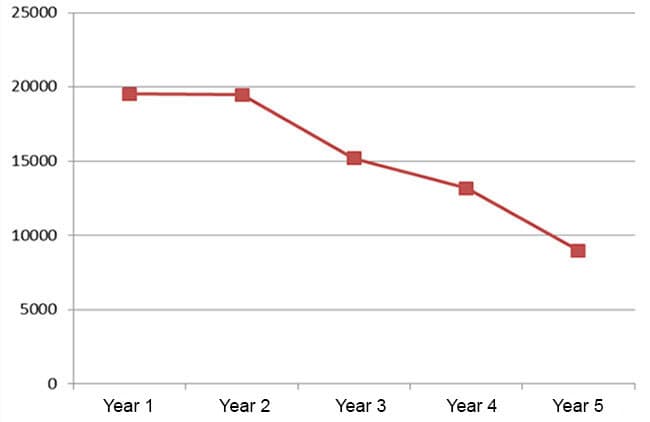
19514.32 |
Year 2 – Implementation & Discovery |
$911,040.68 |
1.02% |
19473.33 |
Year 3 – Project 2 Executed |
$707,866.10 |
-22% |
15190.07 |
Year 4 – Project 2 Executed |
$635,858.35 |
-10% |
13177.53 |
Year 5 – Project 2 Executed |
$417,709.89 |
-34% |
8982.54 |
Total Cost/Time Reduction |
$479,354.33 |
-53% |
10531.78 |
Cost Trend in USD (Year 1 through Year 5)
Labor Trend in Hours (Year 1 through Year 5)
The following conclusions can be drawn from the data above:
Additional value-added items helped move the facility towards a best-in-class ranking for maintenance delivery. Examples of this are 35 assets that received structural upgrades due to bases that had excessive movement, caused by flexing of the supporting structure. All 35 machines have shown a significant reduction in vibration and vibration-induced noise.
We took several steps outside of the original contract scope of work to assist with the hospital’s commitment to continual improvement. Examples are as follows: